About the history and the future of publication

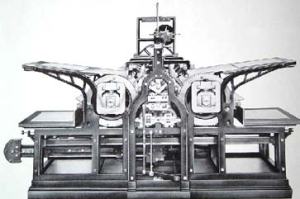
The publishing of scientific journals, begun in the 17th century, expanded greatly in the 19th as new fields were emerged and divided into subfields. Academic publishing is then undergoing major changes, as it makes the transition from the print to the electronic format. In the past, before the Internet invented, the scientist had to write to the publisher to have a copy of any article, which takes long time to be in the hand of the scientist.

‘A proper research deserves a decent scientific journal’

The Internet brings a new trend to the commercial publishers and scientific societies as facilitated the online services to the authors and readers, and also supported the open access journals and make them free to every one. Although there are hundreds of free publishing journals, which are free to all people, scientists are still targeting the commercial publishers to publish their work. The question here is why?. In order to answer this question, the two articles: ‘academic journal publishing’ and The Basics of Academic Publishing must be read. The scientists seek high impact factor journals, which almost all of them are commercial. The publishers in the commercial journals are responsible for the quality of research being published. Moreover, publishers are competing with each other to provide authors and readers with online service tools such as online peer review software, email alert services and multimedia features.

How young researchers see the future of publication?

One of the most difficult tasks for young researches is publication particularly in high impact factor journals. What the big publishers have done to make the publication is easy task for the young researchers. Publishers always target the big scientists and research group, while young researchers struggle to have their research published. The publication fees should be reasonable for the young, or publishers can create journals for young researches.

In conclusion, publishers should carry on protecting the research integrity, developing their services. However, they should make the future of publication more attractive specially for young researchers.

Posted in Uncategorized | Leave a comment

Copyright issues

Copyright and intellectual property are the terms that scientists, inventors, businessmen and entrepreneurs really need to know the fundamental and the basic knowledge of them and the main differences in order to protect their ideas, products and investments. Copyright refers to the exclusive right to make copies, license, and otherwise exploit a literary, musical, or artistic work, whether printed, audio, video, etc. Statute of Anne was the first copyright law started in England in 1710, which introduced the concept of the author of a work being the owner of its copyright, and laid out fixed terms of protection. Intellectual Property is a property that results from original creative thought, as patents, copyright material, and trademarks. Thus, it can be said that copyright, trademark, and patent law fall under the umbrella of intellectual property.

intellactual

The copyright legislation started to appear in other countries such as the united state in 1790, which was based on the English version of Statute of Anne. However, no global agreement for the copyright was achieved until the 19th century. The first international agreement governing copyright was the Berne Convention, which was introduced to provide mutual recognition of copyright between nation states, and to promote the development of international standards for copyright protection. The Berne Convention was first adopted in 1988 and it is still considered by all major countries as the international copyright law.

berne

The age of Internet in the twenty first century was of great interest for people in academia, businesses and industry. However, it brings also a serious problem for many people as it put their work on-line and could be easily manipulated and copied without the permission of the owner. Another major concern is due to the development of the computing and softwares, which allow some people to hack into other people computers, and steel important data, ideas and information.

 In the past, people were required to register their work in order to be protected. However, one of the biggest changes implemented by the adoption of the Berne Convention was to extend copyright protection to unpublished works, and remove the requirement for registration. In other words, In countries of the Berne Convention this means that an individual owns the copyright of any work they produce as soon as it is recorded in some way.

Posted in Uncategorized | Leave a comment

The journalism between the printed paper and mobile.

images

The term journalism is believed to be of French origin and derived from the word for “day” (“jour”). The concept of journalism means the production and the dissemination of information that satisfy public interests. In the past, information used to be disseminated by letters and people moving from place to place such as singers, businessmen, and travellers. They travel across the world attending different events and talk about their experience. The need for information grew as the time passes due to many reasons such as the increase in population, trade exchange and so on.

It is said that Europe is the birthplace of journalism. The invention of the printing press in the 15-century was the beginning of the modern media in Europe. The shape of journalism has changed over the time from free issues to the age of the commercialization. The printed weekly newspaper was first appeared in Basel by 1610, in Frankfort and Vienna by 1615, in Hamburg by 1616, in Berlin by 1617 and in Amsterdam by 1618. The first newspaper printed in England appeared in 1621. It was so difficult to find news that could fill these weekly versions. So, many publishers failed to meet this demanding schedule, and their newspapers appeared late. In the century 18, the freedom of press and the trust of government led to the growing demand for newspapers to rise from the thousands to the hundreds of thousands and eventually to the millions. However, the revolution of the printed newspapers was hindered by the Internet age. Newspaper companies were losing advertisers, readers, market value, and, in some cases, their sense of mission at a pace that would have been barely imaginable just few years ago.

Publishers have tried to rescue the printed newspaper but they couldn’t, and instead they have created Web sites that benefit from the growth of online advertising, but the sums are not nearly enough to replace the loss in revenue from circulation and print ads.

Philip Meyer, in his book “The Vanishing Newspaper” (2004), predicts that the final copy of the final newspaper will appear on somebody’s doorstep one day in 2043

Now, the smart phones has played important role in killing the newspaper as the user can read many newspaper and magazine using his own mobile for free. Web3 is coming and i wonder if the printed newspapers will be totally ended the online newspaper will be in charge for owning information and selling it.

Posted in Uncategorized | Leave a comment

The different shapes of economy and publishing

The concept of publishing in the modern time depends on three important inventions including writing, paper and printing. The rapid development of technology and the industrial revolution has a major influence on publishing moving from the first steam powered presses printer (Figure 1) in the 19th century to the advanced printing technology in the current days. The development of documents took at least 50 million years for society to transform from spoken languages to writing, about 5000 years from writing to printing, 500 years of printing to the development of sight-sound media such as television, radio and photography, and then about 50 years from the sight-sound media to the age of computer. More recently, the continuity of the development of computing and networking technologies has expanded the document’s boundaries and improve the library services.

steampress

Fig.1 the first steam powered presses

The evolution of publishing was due to the development of the society, which is believed to be the driving force for the knowledge economy. The idea of knowledge economy was defined first by Drucker’s (1969) as the role of the ‘knowledge worker’ in manufacturing industries to develop new products and services. Most of the developed countries have moved from the traditional economy to other forms of economy such as knowledge economy, creative economy and sharing economy. Share economy can be defined as a socio-economic system built around the sharing of human and physical resources. It includes the shared creation, production, distribution, trade and consumption of goods and services by different people and organizations. The information society like many other aspects have been influenced by the different shapes of economy, for example, the information can be shared and used by people and organizations as the Internet and mobile technology can facilitate the information exchanges between them. Publishing first was about books, however, a variety of publishing forms have been developed such as online articles and books. The web 3 is coming and I’m wondering about its influence on publishing.

Posted in Uncategorized | Leave a comment

The evolution of publishing

Publishing can be defined as the activity of making information accessible and available to people. John Feather, however, defined the publishing as the commercial process of producing books to the public. From the above definitions two questions can be raised; why is publishing and how?. In the past, publishing was depending on four factors including the writer, the publisher, the retailer and the consumer. The evolution of digital technologies has changed the old model as first the retailers started to use small places or online shop to sell books. Amazon is a good example of the evolution of publishing. Moreover, the online bookstores can know more information about the customers such as the history reading lists and the buying habits.

The evolution of publishing started from 1400 when the printer was invented and continued to develop until the advent of newspaper in 1800 as shown in the diagram below. The industry of publishing dramatically improved which became the most profitable industry in the UK. However, new players have entered to the game since 2000 due to the revolution of digital technologies.

The evolution of publishing from 1400 to today

The evolution of publishing from 1400 to today

Publishing is important for academics, students and businesses. It’s important for academics in many ways; it protects their work if it is published and also makes them updated with the recent publication on a specific subject. On the other hand, businesses have taken the advantages of the need for the new information, and enhance their services to provide people with the information in the easiest way. The advancement in digital technology has played important role in shaping the future of publishing. Many other factors might have effect on the future of publishing such as the interest of people, the company services and publishing regulations. There is saying ‘If you have direct access to your fans, you’ll be successful no matter what happens in the big picture’, which explain the rise of self-publisher business. Some authors have their own websites to sell their products, and they could sell them two times higher than on Amazon. The last point I would raise is whether the publishing should be free to allow people in poor areas to publish their work and read other people work.

Posted in Uncategorized | Leave a comment

The Semantic Web

The Semantic Web is a web of data. It is the extension of the World Wide Web that enables people to share content beyond the boundaries of applications and websites. The semantic web refers to two things. Firstly, It is about common formats for integration and combination of data drawn from different sources, where on the original Web mainly concentrated on the interchange of documents. Secondly, It is also about language for recording how the data relates to real world objects. That allows a person, or a machine, to start off in one database, and then move through an unending set of databases, which are connected not by wires but by being about the same thing.

Artists’ Books Online represents the concept of the Semantic web as it is designed to promote critical engagement with artists books and to provide access to a digital repository of metadata, scans, and commentary. ABsOnline was started in 2004, and it is still under development by the University of Virginia. ABsOnline contains files that display a collection of books, exhibits and essays for the subject of artists. There is an index of agents (authors, publishers, binders, printers etc. of books and works represented), titles (of works, books, and sometimes objects), contributors (authors of essays, exhibits, commentary), and of collections and other resources. The information of ABsOnline is organised by DTD (The Document Type Description) (DTD) in a three-level hierarchy of Work, Edition and Object.

Screen Shot 2014-12-08 at 00.41.14

The exhibits below are organised by the category work, and each work consists of many editions. Each edition may contain one object or more.

Screen Shot 2014-12-08 at 01.12.24

The current Web is based mainly on documents written in Hypertext Markup Language (HTML), which describes documents and the links between them. Semantic web represented by XML, However, can describe arbitrary things such as people, meetings, or airplane parts.

One of my previous posts titled “Are we ready for Web3?, and I think the Semantic Web can answer this question. “Tim Berners-Lee has described the semantic web as a component of Web 3.0″. Further developments are required to overcome some challenges of the Semantic Web.

Posted in Uncategorized | Leave a comment

My experience with DITA

This is my first experience with blogging (thanks DITA), which has given me a great opportunity to explore this world and improve my blog skills. My blog host is Wordprss.com, It is a free blog site and contains many free templates. These templates can be customized and modified in many ways, including selecting the background color, font style, theme and other various features. In the beginning, I found it a bit difficult to shape my blog site and use all the features, however, with the time and some help from the tutor I could produce my lovely site. My blog topics mainly are focused on DITA. I discussed different aspects in related to DITA, and also I include a description of the exercises taken throughout the course. Blogging allow me to interact with my course mates to share and discuss ideas and knowledge. I loved my blog site and now blogging is my passion and I will keep blogging on scientific subjects.

The information technology is one of the most important subjects in my country, and it was recommended by the head of library and information department in University of Princesses Norah ben Abdurrahman to study it. I think this subject is a great start for the PhD study. The course gives insight into the technical background required to store, structure, manage and share information in our society and how we engage tactically with information and knowledge in organizations. In order to achieve this, we studied different topics and learnt many applications to treat this information. Topics include: introduction to computing, internet and web, database systems and searching, Web 2.0 technologies (blogs, wikis, etc.), semantic web, information architecture. We started this course with obtaining general background about the information architecture and the revolution in computing and the Internet. We have learnt about the information retrieval and the difference between the structured data and the unstructured information retrieval. The concept web service and how to create an application and embedding Content is one of the interesting areas in this course. We applied this concept to create an application to tap into Twitters’ API and also to obtain some achieving tweets. In addition, we learnt about the Altimetric, which is one of the methods to measure the impact of the published articles. Also, we studied how to analyse data and texts in order to summarize them into useful information. We used different textual tools such as Wordle, Many Eyes and Voyant Tools to analyse different type of texts.

Posted in Uncategorized | Leave a comment

Data Mining

This week in DITA we looked at Data Mining, which is generally defined as the process of analyzing data from different perspectives and summarizing it into useful information. The overall goal of the data mining process is to extract information from a data set and transform it into an understandable structure for further use. Last week, we went through some text analysis methods, which are a subset of data mining.

This blog will explore my experience of practicing data mining using two major projects: Old Bailey Online and one of the digitization projects from the University of Utrecht.

The Old Bailey Online:

The Old Bailey Proceedings Online allows access to over 197,000 trials and biographical details of approximately 2,500 men and women executed at Tyburn, free of charge for non-commercial use.

I started with the original site search engine, and use London as the keyword to focus the search in this city, and to refine my search I chose Richard as the given name. I selected Murder crime in the period of 1680 to 1850. The verdict I chose was Guilty including all the punishment categories. I used the option calculate total to display the full number of the results obtained.

Screen Shot 2014-11-30 at 21.07.38

The API Demonstrator is different from the original site research in different ways. Firstly, the API allows a search by trial rather than by offence, defendant, etc. as is the case on the original site; and, second, that it allows you to explore the result sets, before exporting them to Zotero (for weeding), or to Voyant Tools for further linguistic analysis.

I used the API to search for the murder crime in London committed by male on women in the period of 29 April 1674 to 1 April 1913. This query resulted in 25 trials. These results can now be explored in detail either by choosing Undrill in relation to specific query components, or by using Break Down to identify relevant sub-sets of trials. Also, we can identify similar texts to any trial by using the More Like.

Screen Shot 2014-12-06 at 23.11.31

Screen Shot 2014-12-06 at 23.31.21

Exporting the results using Voyant Tools

The result generated can be explored for further analysis using text analysis tools such as Zotero and Voyant tools. I used the option of sent to Voyant to export the full text of 100 trials to the Voyant Tools site as shown below.

Screen Shot 2014-12-07 at 00.04.02

Screen Shot 2014-12-07 at 00.03.18

Utrecht University Digital Humanities Lab Text Mining Research Projects

I explored Circulation of Knowledge and Learned Practices in the 17th-century Dutch Republic as a project of Utrecht University. This project aims to access free, online search to historical sources from various disciplines all over the world. This project allow scholars to discuss problems, share information and add transcriptions or footnotes. One of the great advantages of this project is its ability to invoke new questions, new interpretations and new information, and to bring all this together on an expanding website. The application used by this project called ePistolarium, which allows researchers to browse and analyze around 20,000 letters that were written by and sent to 17th century scholars who lived in the Dutch Republic. In addition, the ePistolarium enables visualizations of geographical, time-based, social network and co-citation inquiries.

I used this appellation to search for all the letters that contained the phrase of Digital Information in the period of 1650 t0 1690. There was 25 results, which can be displayed either as a list or visualised as shown below.

Screen Shot 2014-12-07 at 01.02.27

Screen Shot 2014-12-07 at 01.04.41Screen Shot 2014-12-07 at 01.08.31

Posted in Uncategorized | Leave a comment

Visualisation Tools for Text Analysis

In this Week, we have learnt about how to analyze a text and count the frequency of words using different tools (http://www.wordle.net) (http://many-eyes.com) and (http://voyant-tools.org) to surf and stumble with the text. In These electronic web sites, we can upload a set of data or information to see which words are most often used and which are used the least in which this information will be analyzed and then displayed in different ways such as maps and charts. I have applied these three tools on the data created previously from Archive Twitter and Almetrics analysis.

Wordle,

Starting with Wordle, which is a tool to perform a basic level of text analysis and produce a word cloud that can be customised with different fonts, layouts, and colors. When I input the data created from Twitter and Almetrics into Wordle, the website asked me to download the JavaScript application in order to produce the word clouds. Wordle is limited in terms of customisation comparing to Voyant tool for example. Word clouds produced by Wordle from both Twitter and Almetrics shown below with different charts.

Word cloud from Twitter Analysis

Word cloud from Twitter Analysis

Word cloud from Almetrics Analysis

Word cloud from Almetrics Analysis

Many Eyes

This website requires sign in to use its features. I have created my account and upload the data created from Twitter and Almetrics analysis, however, the website was very slow and the page took long times to response. This web site has a variety of visualizations can be selected from its collection, and allow some customisation such font and the legend mode. Although this web site is very slow, it allows users to remove some unmeaning words as shown below. In addition, when the size of data uploaded is small, Many Eyes response is quickly and the opposite is true.

Word cloud from Almetrics Analysis

Word cloud from Almetrics Analysis

Word cloud from Twitter Analysis

Word cloud from Twitter Analysis

after removing some unmeaning words

after removing some unmeaning words

Voyant Tools

Voyant is the best tools and it is still under continuing development by its creators. This website performs advanced level of text analysis comparing to the previous methods as it analyses the text in seconds and removes the unwanted words in order to produce a meaning word cloud as shown below. However, Voyant is unable to modify some common features such as font and colours.

Word cloud from Twitter Analysis

Word cloud from Twitter Analysis

Word Cloud from Almetrics Analysis

Word Cloud from Almetrics Analysis

Voyant tools goes beyond the word cloud and provides users with more information about the text including a full text reader, summary, a word trends graph, the frequency and the count of words in the entire corpus, and to exclude individual words and see how they appears in the documents and the context. The screenshots below demonstrate the data created from Twitter and Almetrics analysis. for Example, from the screenshot of data created by Almetrics, as we can see the most frequent words were disaster and health. On the other hand, from the data created by Twitter Analysis, the most used word in the entire corpus was the hashtag cyclist. We can also exclude any word and see more information about it. For example, we highlighted the word Analysis to obtain more information how it appears in document and context.

Screenshot of data from Twitter analysis

Screenshot of data from Twitter analysis

Screenshot of data from Almetrics analysis

Screenshot of data from Almetrics analysis

Summary

Word cloud may be a good method to know the most important keywords of the text and to obtain quantitative analysis. However, it is not a good qualitative method. Another tools such as Voyant can tell more about the text and provide users with more information about the text, but, more development in these tools is required to obtain advanced quantitative and qualitative analysis.

Posted in Uncategorized | Leave a comment

Altmetric Explorer, a new indicator for research impact

The last week, we got insight into Almetrics, which is one of the methods to measure the impact of the published articles. In the past years, the most common metric for evaluating research impact has been the number of times a research article is cited by other articles. Citations are not the only way to represent the impact of a research article. A few alternative indicators have been the subjects of webometrics and bibliometrics research for years, including download counts and mentions in patents. However, as scholarly communication moves increasingly online, more indicators have become available: how many times an article has been cited or mentioned by the social media such as Twitter, Facebook, blogs and so on.

The advantages of Altmetric

  • A more nuanced understanding of impact, showing us which scholarly products are read, discussed, saved and recommended as well as cited.
  • Often more timely data, showing evidence of impact in days instead of years.
  • A window on the impact of web-native scholarly products like datasets, software, blog posts, videos and more.
  • Indications of impacts on diverse audiences including scholars but also practitioners, clinicians, educators and the general public. [1].

Potential Challenges of Altmetric

  • Almetrics is a quantitative method.
  • The possibility that altmetrics may be gamed or artificially increased.
  • The integration of different disciplines [2].

In the last exercise, we used the Altmetric explorer to explore and obtain bibliographic and social media data. The Altmetrics Explorer has a filtration system to search for any article at any time. If you are interested in a specific article, you can use Digital object identifier (DOI) for example to access the article directly. The Altmetrics Explorer uses the Altmetric score and donut to give users a quick way to assess how much attention large sets of scholarly articles have received online. The Altmetric score is a quantitative indicator of the attention that a scholarly article has received. The small donut shape is also providing quick information about articles. The number provided in the centre of the donut is the Almetrics score, and the colors surrounding the donut represent the mix of sources mentioning that score blue for Twitter, yellow for blogs, red for mainstream media sources and so on.

I’ve done a search for all the articles mentioned in the subject of Digital information technologies for the last month, and the results is shown in figure 1.

Figure1

Figure1

By clicking on the Altmetric score of two articles, we will obtain more information about how many times these articles have been mentioned by different resources. As it can be seen from figure 2, the article is ranked 34 of 56,008 in the journal called PLoS ONE, and it has been mentioned for example 42 in the news outlet and 215 times in Twitter. In another journal, the article in figure 3 is ranked first of of 171, and it has been mentioned 8 times in the news outlet and 727 times in Twitter.

Figure2

Figure2

Figure3

Figure3

Reference:

[1] https://www.asis.org/Bulletin/Apr-13/AprMay13_Piwowar.html.

[2]https://asis.org/Bulletin/Apr-13/AprMay13_Liu_Adie.html

Posted in Uncategorized | 2 Comments